CV Lecture 2
Lecture 2
Colour and Colour Images
- A colour image has three components: red, green and blue
- The components are usually called channels
Electromagnetic radiation
All electromagnetic radiation is light, but we can only see a small portion of this radiation所有电磁辐射都是光,但我们只能看到其中的一小部分
the portion we call visible light我们称之为可见光的部分
Cone-shaped cells in our eyes act as receivers tuned to the wavelengths in thisnarrow band of the spectrum我们眼中的锥形细胞充当接收器,可调谐到光谱中这个窄带内的波长
Other portions of the spectrum have wavelengths too large or too small andenergetic for the biological limitations of our perception.光谱的其他部分的波长对于我们感知的生物学限制来说太大或太小且能量过大。 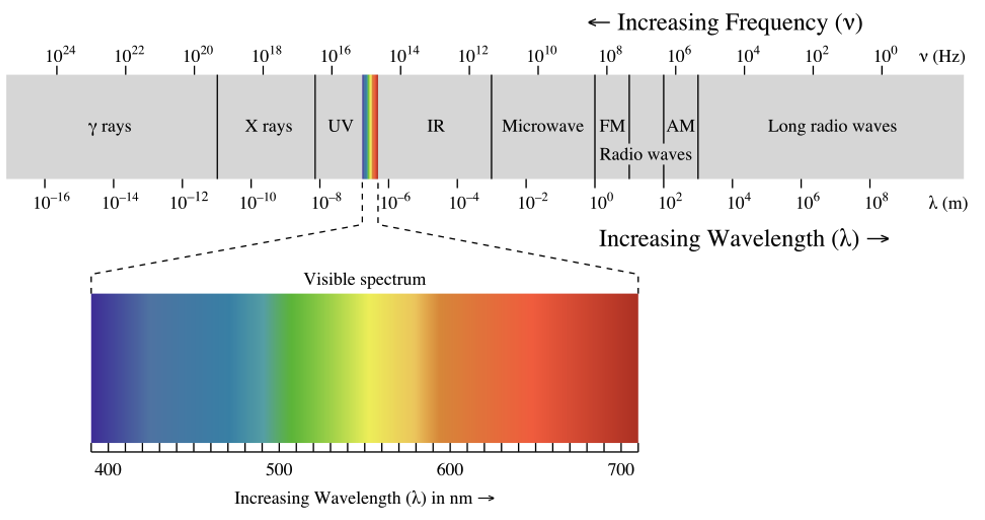
K-means Clustering for Colour Quantization
- Observations are partitioned in K clusters, ergo the name of the method
- 观测结果被划分为 K 个簇,因此得名该方法
- Each new observation is tagged as member of a cluster, using Euclidean distance
- 使用欧几里得距离将每个新观测结果标记为簇的成员
- Each time a cluster changes size, its centre is recalculated
- 每次簇大小发生变化时,都会重新计算其中心
- If we want to use K-means for colour quantization, we use colours are clusters
- 如果我们想使用 K 均值进行颜色量化,我们会将颜色用作簇
- Algorithm termination follows the usual practice: either number of max iterations reachedor centres do not change much
- 算法终止遵循通常的做法:达到最大迭代次数或中心变化不 大
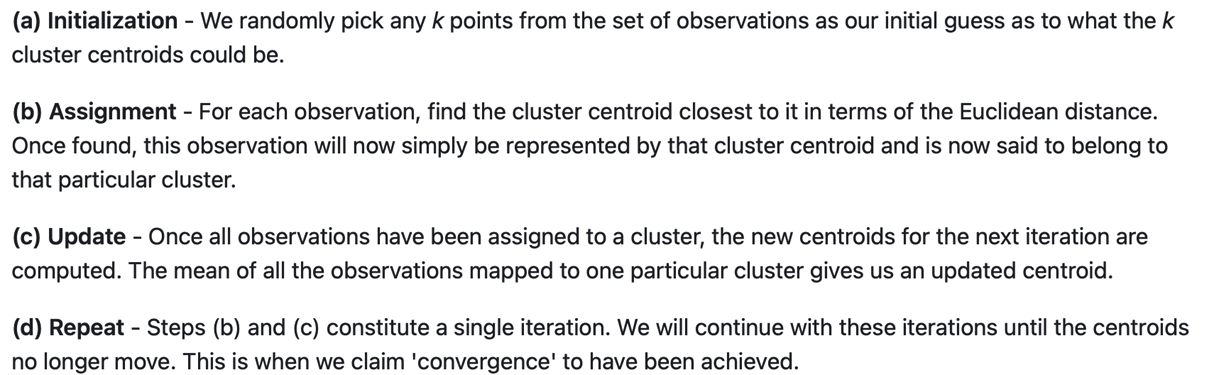
- 算法终止遵循通常的做法:达到最大迭代次数或中心变化不 大
Probability Density Function (PDF)
- The histogram model is a crude version of a probability density function
- A probability density function is a measurement of how often an observation falls within a specified range
- In our case the bins in the UV colour space
- Once the accumulator is in place, it must be normalised
- This means all bins are summed together and then each bin divided by the sum
- Then each bin will represent of the probability of a given colour
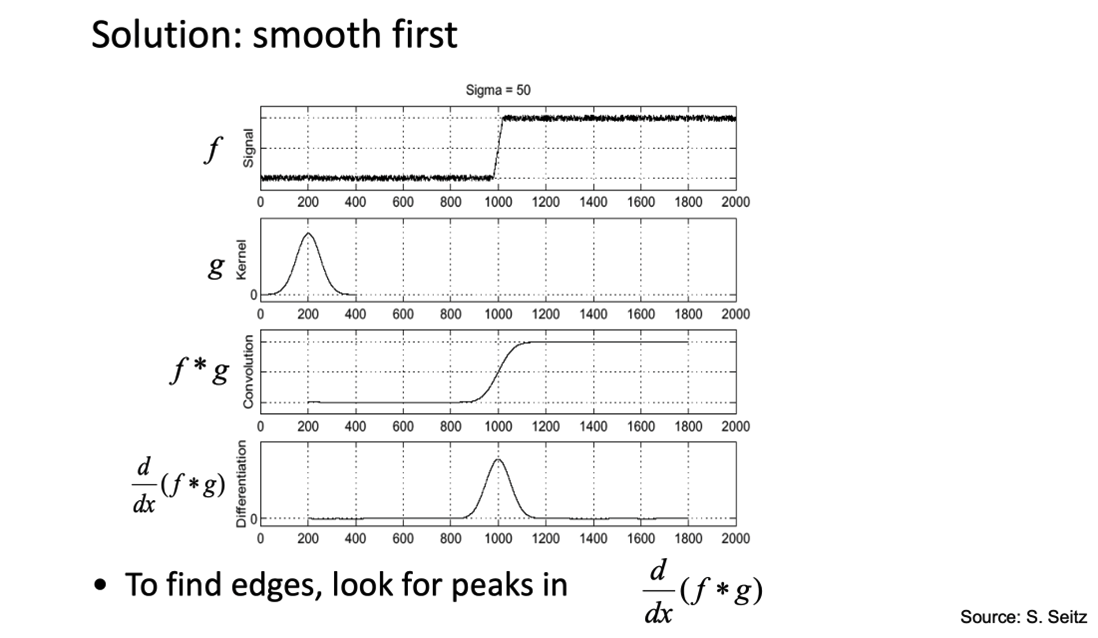
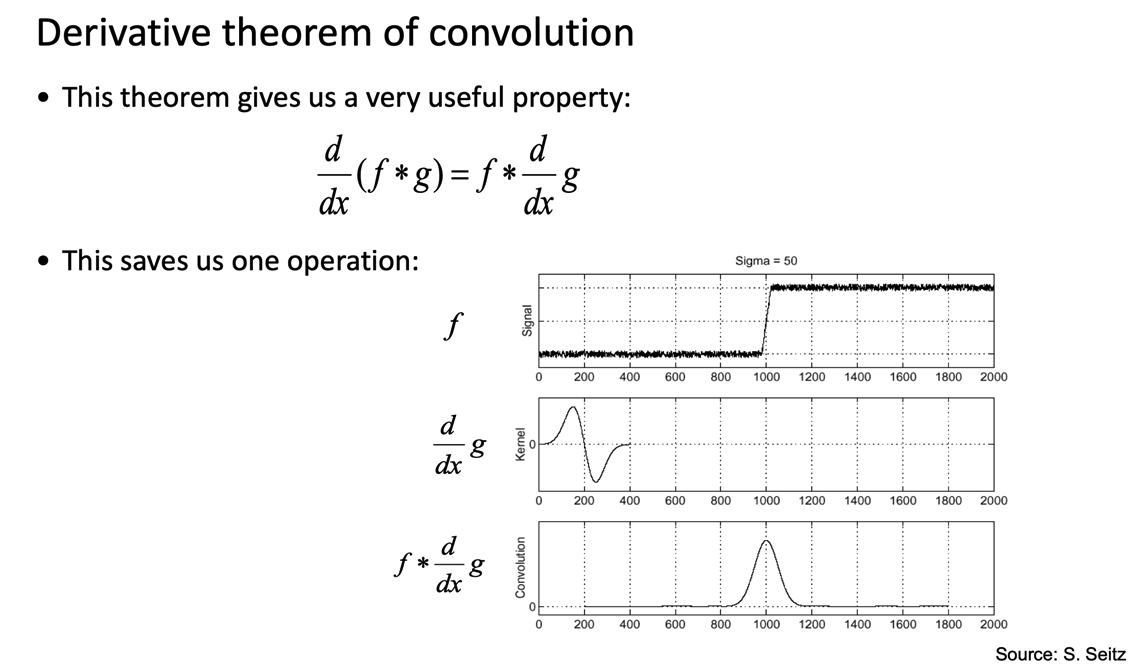
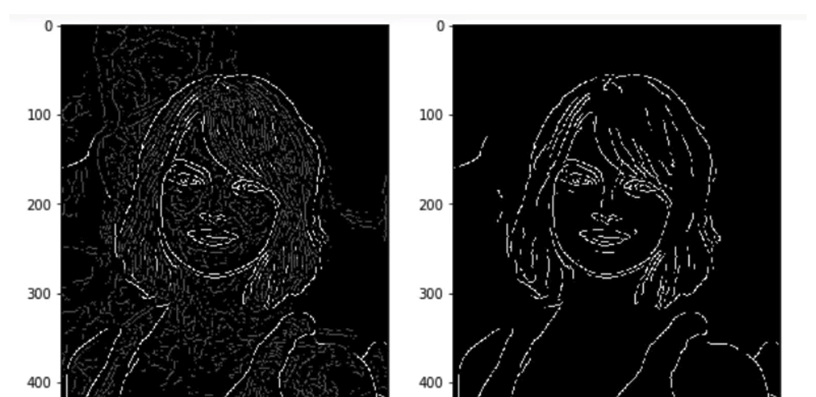
Better ways to find edges
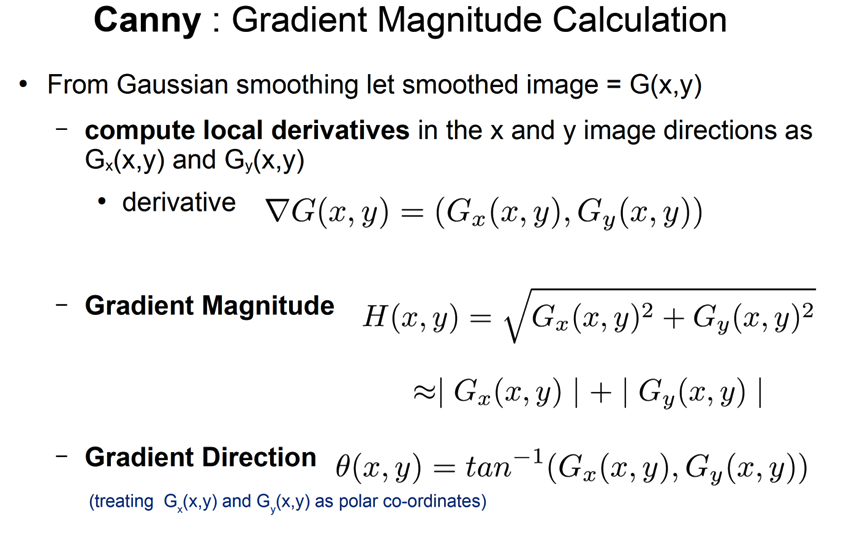
Image gradient
- The gradient of an image:
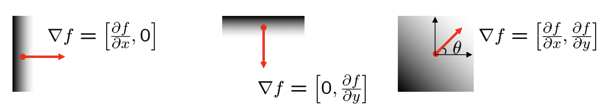
The gradient vector points in the direction of most rapid increase in intensity The gradient direction is given by $\theta=\tan^{-1}\left(\frac{\partial f}{\partial y}/\frac{\partial f}{\partial x}\right)$ - how does this relate to the direction of the edge? The edge strength is given by the gradient magnitude
\[\|\nabla f\|=\sqrt{\left(\frac{\partial f}{\partial x}\right)^2+\left(\frac{\partial f}{\partial y}\right)^2}\]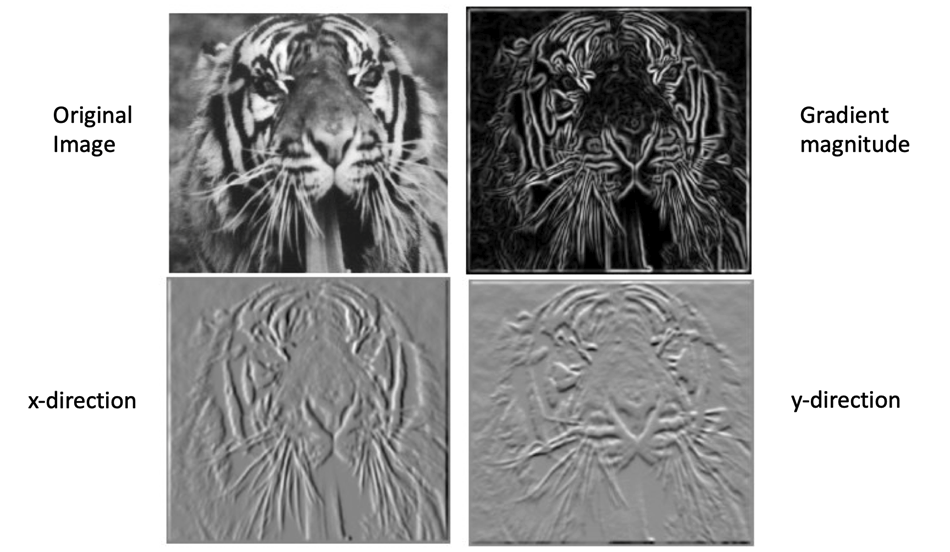
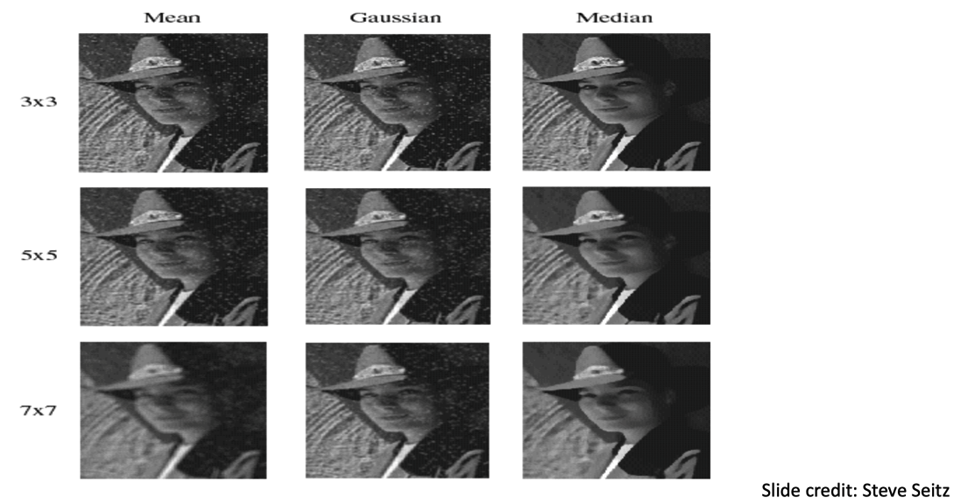
Effect of noise
- Our edge operators implement finite differences, local operations
- 我们的边缘运算符实现有限差分、局部运算
- If we add noise to an image, we have neighbouring pixels with very different values
- 如果我们向图像添加噪声,则相邻像素的值会有很大差异
- The more they differ the stronger is the filter response
- 它们的差异越大,滤波器响应越强
- Therefore, we must smooth an image before running an edge filter
- We have learnt the Gaussian operator
- You can also use the mean, we have come across as well, and the median
- The median is calculated by a
- first sorting all the pixel values from the surrounding neighbourhood into numericalorder and
- then replacing the pixel being considered with the middle pixel value
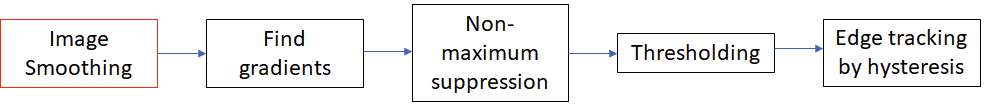
Edge detection steps
Usually there are three steps in the edge detection process
- Noise reduction
- Suppress as much noise as possible without removing edges.
- Edge enhancement
- Highlight edges and weaken elsewhere (high pass filter)
- Edge localisation
- Look at possible edges (maxima of output from previous filter) and eliminate spuriousedges (often noise related)
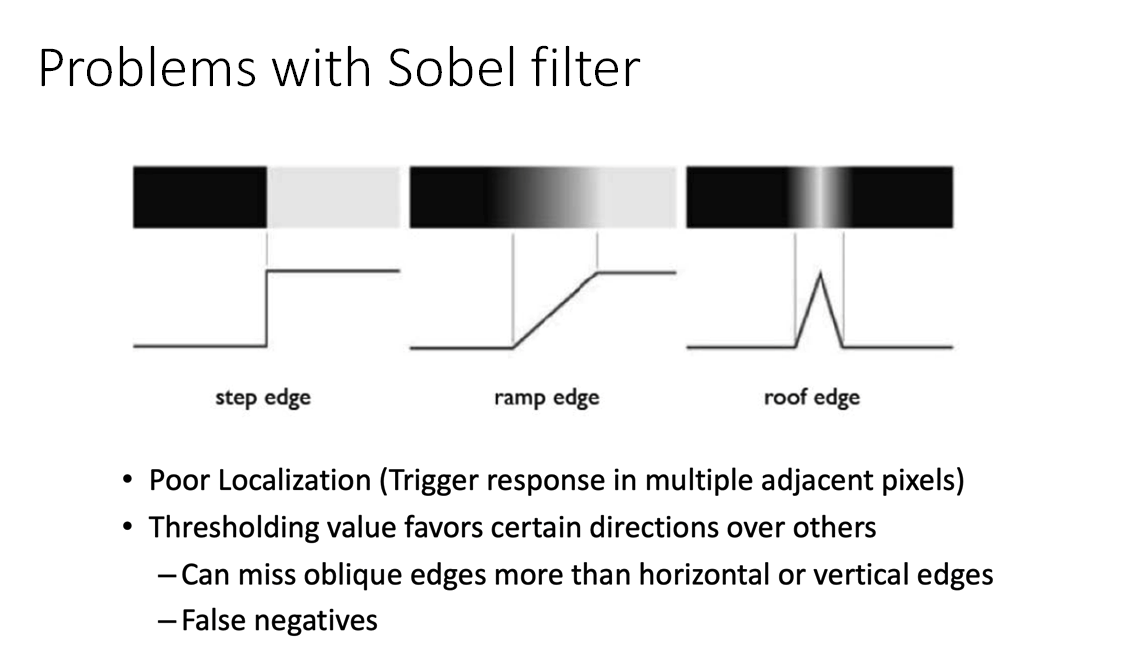
Problems with Sobel filter
Advanced Edge Detection
Canny edge detection
Gaussian smoothing
- The result of applying Gaussian Filter on the image is blurring and reducing the noise from the image
- The Gaussian function formula is used for generating a Gaussian filter mask
- In this formula, 𝜎 (sigma) controls the width of the filter which is impact averaging overthe neighbourhood
- 𝜎 should be greater than 0
Canny : Gaussian Image Smoothing
- Smooth image with a 2D Gaussian
- Method: convolve with a mask that approximates the 2D Gaussian kernel
- Result: pixels averaged over local neighbourhood with preference towards the centre
- smooths noise without too much blurring of edges
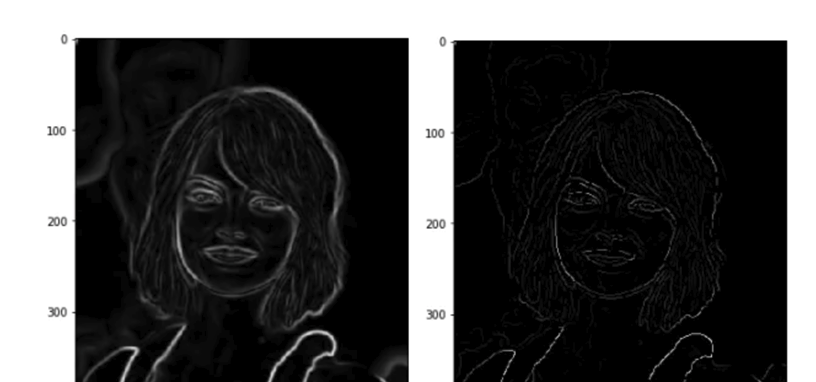
Non-maximum suppression
- The image magnitude produced results with thick edges
- Ideally, the final image should have thin edges
- The principle is simple
- the algorithm goes through all the points on the gradient intensity matrix and findsthe pixels with the maximum value along the edge directions
- Each pixel has 2 main criteria
- 每个像素有 2 个主要标准
- edge direction in radians, and
- 边缘方向(弧度)和
- pixel intensity (between 0–255)
- 像素强度(0-255 之间)
- Based on these inputs the non-max-suppression steps
- 根据这些输入执行非最大抑制步骤
- Create a matrix initialized to 0 of the same size of the original gradient intensitymatrix
- 创建一个初始化为 0 的矩阵,其大小与原始梯度强度矩阵相同
- Identify the edge direction based on the angle value from the angle matrix
- 根据角度矩阵的角度值识别边缘方向
- Check if the pixel in the same direction has a higher intensity than the pixel that iscurrently processed
- 检查同一方向上的像素是否比当前处理的像素具有更高的强度
- Return the image processed with the non-max suppression algorithm
- 返回使用非最大抑制算法处理的图像
- 返回使用非最大抑制算法处理的图像
- Non maximum suppression can be achieved by interpolating the pixels for greateraccuracy
- Non maximum suppression does not provide perfect results
- A low and a high threshold can be used to determine weak and strong edges
- Edge tracking must be implemented as follows
- Weak edges that are connected to strong edges will be actual/real edges
- Weak edges that are not connected to strong edges will be removed
Double thresholding
- It aims at identifying 3 kinds of pixels: strong, weak, and non-relevant
- 它旨在识别 3 种像素:强像素、弱像素和不相关像素
- Strong pixels are pixels that have an intensity so high that we are sure they contribute to the final edge
- 强像素是强度非常高的像素,我们确信它们对最终边缘有贡献
- Weak pixels are pixels that have an intensity value that is not enough to be considered asstrong ones, but yet not small enough to be considered as non-relevant for the edgedetection.
- 弱像素是强度值不足以被视为强像素,但又不至于小到被认为与边缘检测不相关的像素。
- Other pixels are considered as non-relevant for the edge.
- 其他像素被认为与边缘不相关。
- High threshold is used to identify the strong pixels (intensity higher than the highthreshold)
- 高阈值用于识别强像素(强度高于高阈值)
- Low threshold is used to identify the non-relevant pixels (intensity lower than the lowthreshold)
- All pixels having intensity between both thresholds are flagged as weak and the Hysteresismechanism (next step) will help us identify the ones that could be considered as strongand the ones that are considered as non-relevant.
- 所有强度介于两个阈值之间的像素均被标记为弱像素,滞后机制(下一步)将帮助我们识别可视为强像素和被视为不相关的像素。
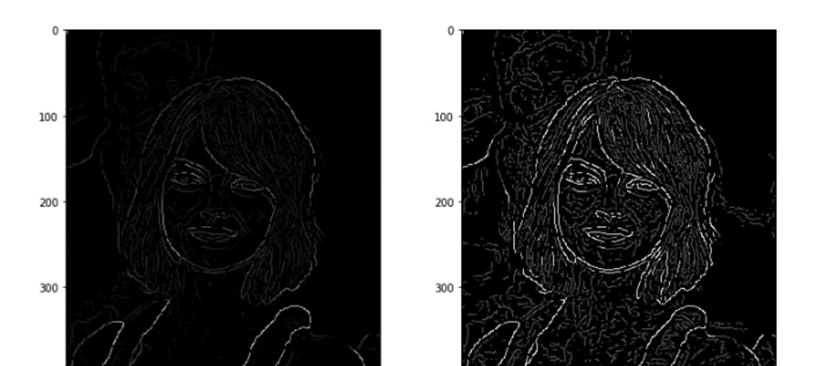
Edge tracking by Hysteresis
- Based on the threshold results
- 根据阈值结果
- The hysteresis consists of transforming weak pixels into strong ones, if and only if at leastone of the pixels around the one being processed is a strong one
- 滞后包括将弱像素转换为强像素,当且仅当被处理的像素周围至少有一个像素是强像素时
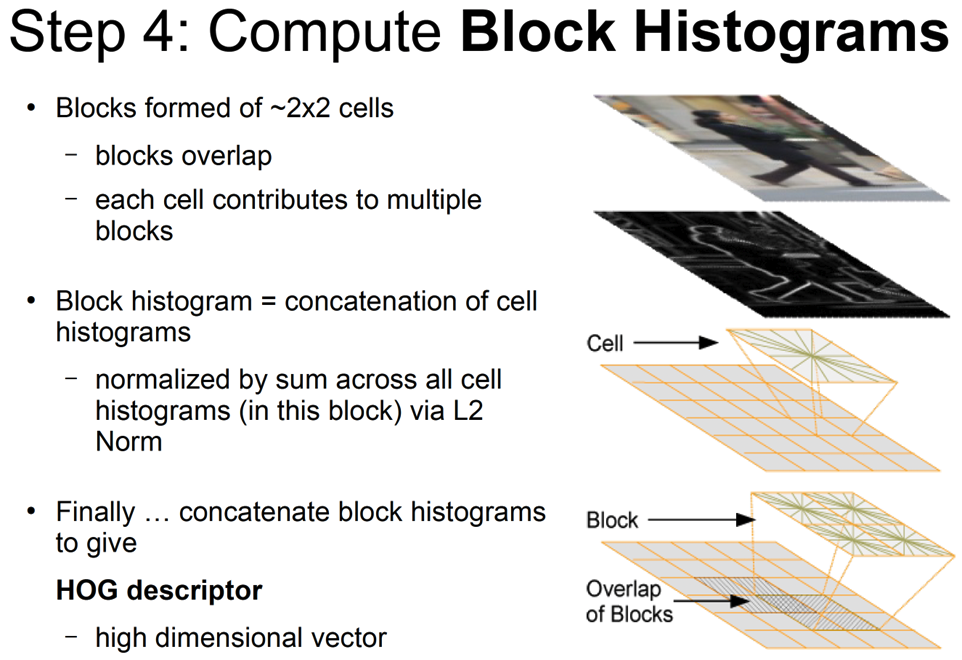
Feature Descriptors
Histogram of Oriented Gradients (HOG)
- HOG, or Histogram of Oriented Gradients, is a feature descriptor that is often used toextract features from image data
- HOG,即方向梯度直方图,是一种特征描述符,通常用于从图像数据中提取特征
- HOG is used for object detection
- HOG 用于物体检测
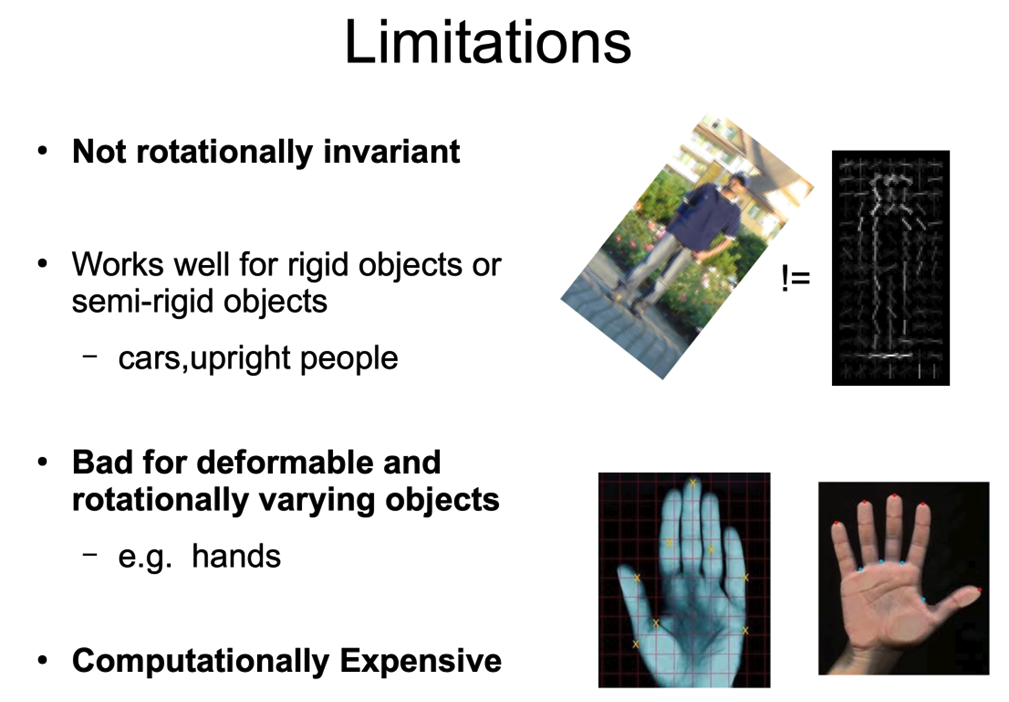
- The HOG descriptor focuses on the structure or the shape of an object
- HOG 描述符侧重于物体的结构或形状
- Please refer to the article by Dalal - https://lear.inrialpes.fr/people/triggs/pubs/Dalal-cvpr05.pdf
Pre-processing for HOG
- We need to preprocess the image and scale it down to the width to height ratio to 1:2
- 我们需要对图像进行预处理,并将其宽度与高度的比例缩小到 1:2
- The image size should preferably be 64 x 128
- 图像大小最好是 64 x 128
- This is because we will be dividing the image into 8 and 16 patches to extract thefeatures
- 这是因为我们将把图像分成 8 和 16 个块来提取特征
- With the specified size (64 x 128) will make all calculations simpler
- 使用指定的尺寸(64 x 128)将使所有计算更简单
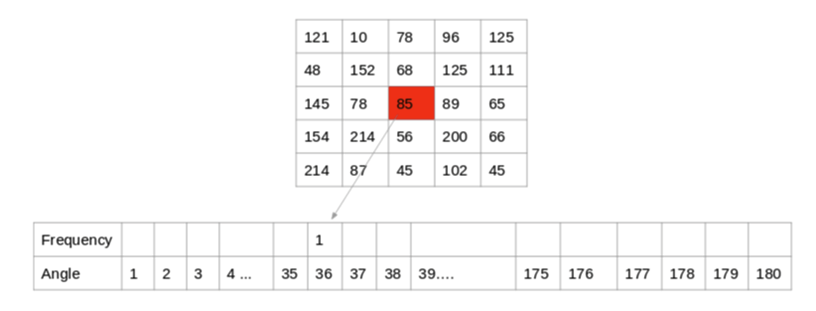
Calculating the gradients and their histogram
- For every pixel, we calculate the gradient magnitude and orientation
- 对于每个像素,我们计算梯度幅度和方向
- Check a previous slide on how this can be done
- 查看上一张幻灯片了解如何执行此操作
- We then create a histogram of local orientations
- 然后我们创建局部方向的直方图
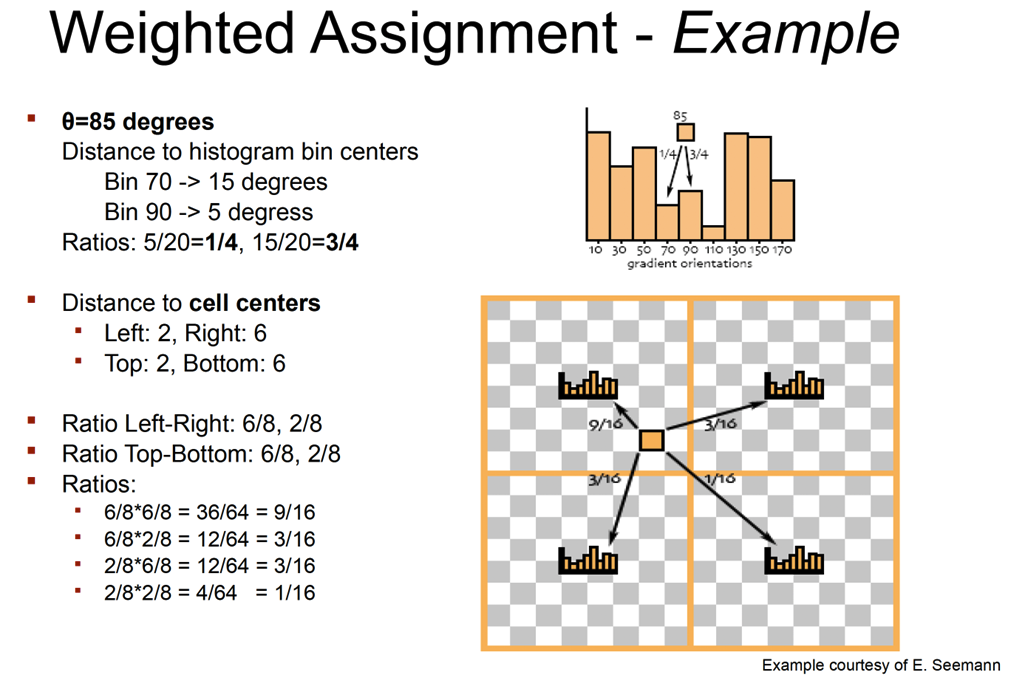
- Pixel 85’s gradient has orientation 36, this contributes to that bin
- 像素 85 的梯度具有方向 36,这有助于该箱体
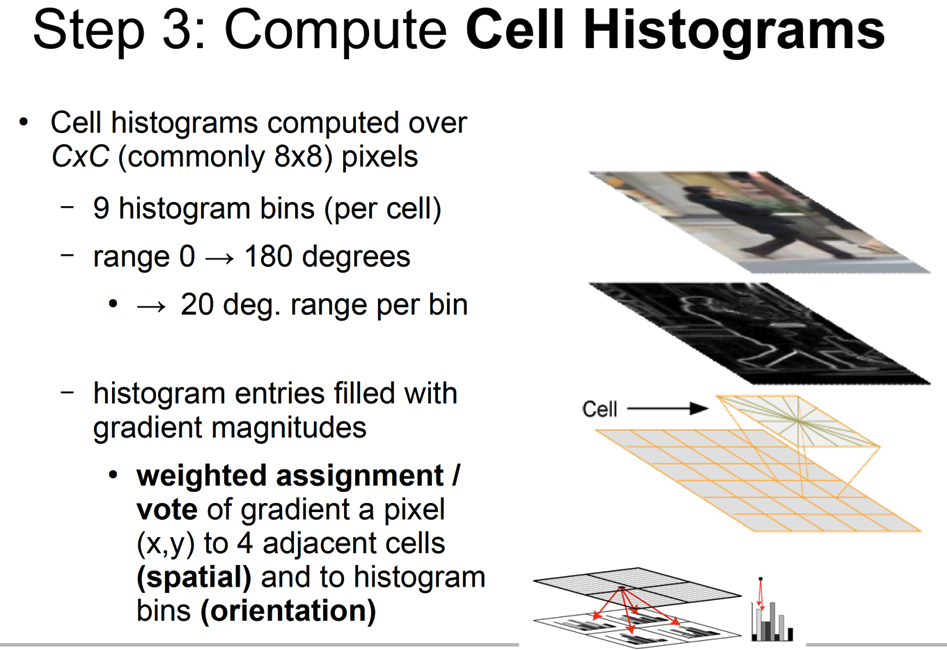
How does HOG work
- Each image is divided in regular cells, say 8x8 pixels
- 每幅图像被划分为规则的单元,例如 8x8 像素
- For each cell a local 1D histogram of gradient directions or edge orientations is accumulated
- 对于每个单元,都会累积梯度方向或边缘方向的局部 1D 直方图
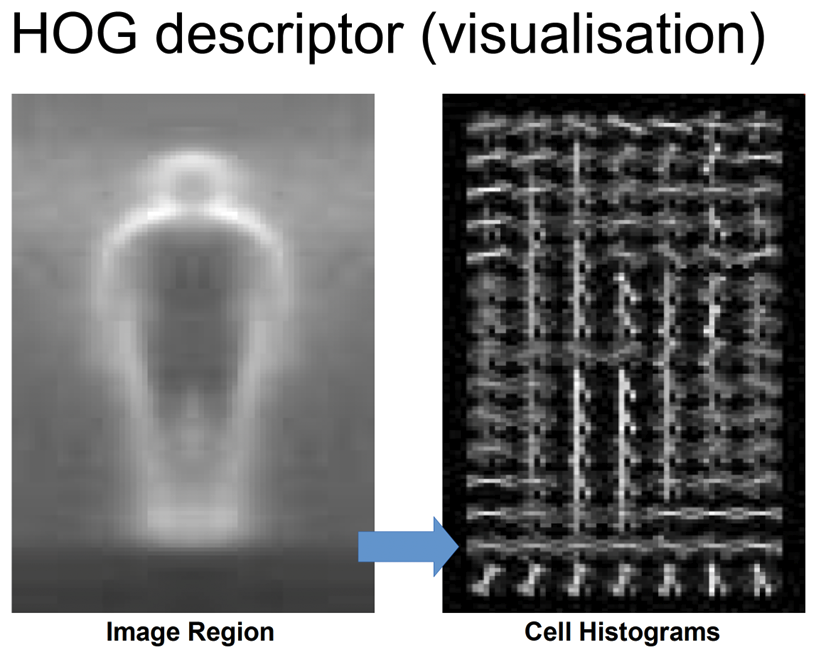
- The combined histogram entries represent the image, or part of it
- 组合的直方图条目代表图像或图像的一部分
- Usually, we want to seek invariance to illumination
- 通常,我们希望寻求对光照的不变性
- We achieve this by accumulating a measure of local histograms “energy” over larger spatial regions (“blocks”) and using the result to normalize all the cells in the block
- 我们通过在较大的空间区域(“块”)上累积局部直方图“能量”的度量并使用结果对块中的所有单元进行归一化来实现这一点
[[2025-01-20-CV-3]]