CV Assignment Part1
![[Assignment Jan Feb 2025.pdf]]
MISCADA – Computer Vision
Assignment – Year 2024/2025
Part 1
Prof. Paolo Remagnino
Introduction
This assignment is split in two parts, with separate deadlines
- Description (15%)
- A thorough description of the used libraries and methods and the results is expected. Please refer to the marking scheme table for more detail
Part 1 (30%). 2月15号
- Part 2 (55%)
Computed Tomography (CT)
A computed tomography (CT) scan is a non-invasive imaging procedure that uses X-rays to create detailed pictures of the inside of the body. CT scans are used to diagnose and treat a variety of conditions, such as tumours, pneumonia and internal bleeding.
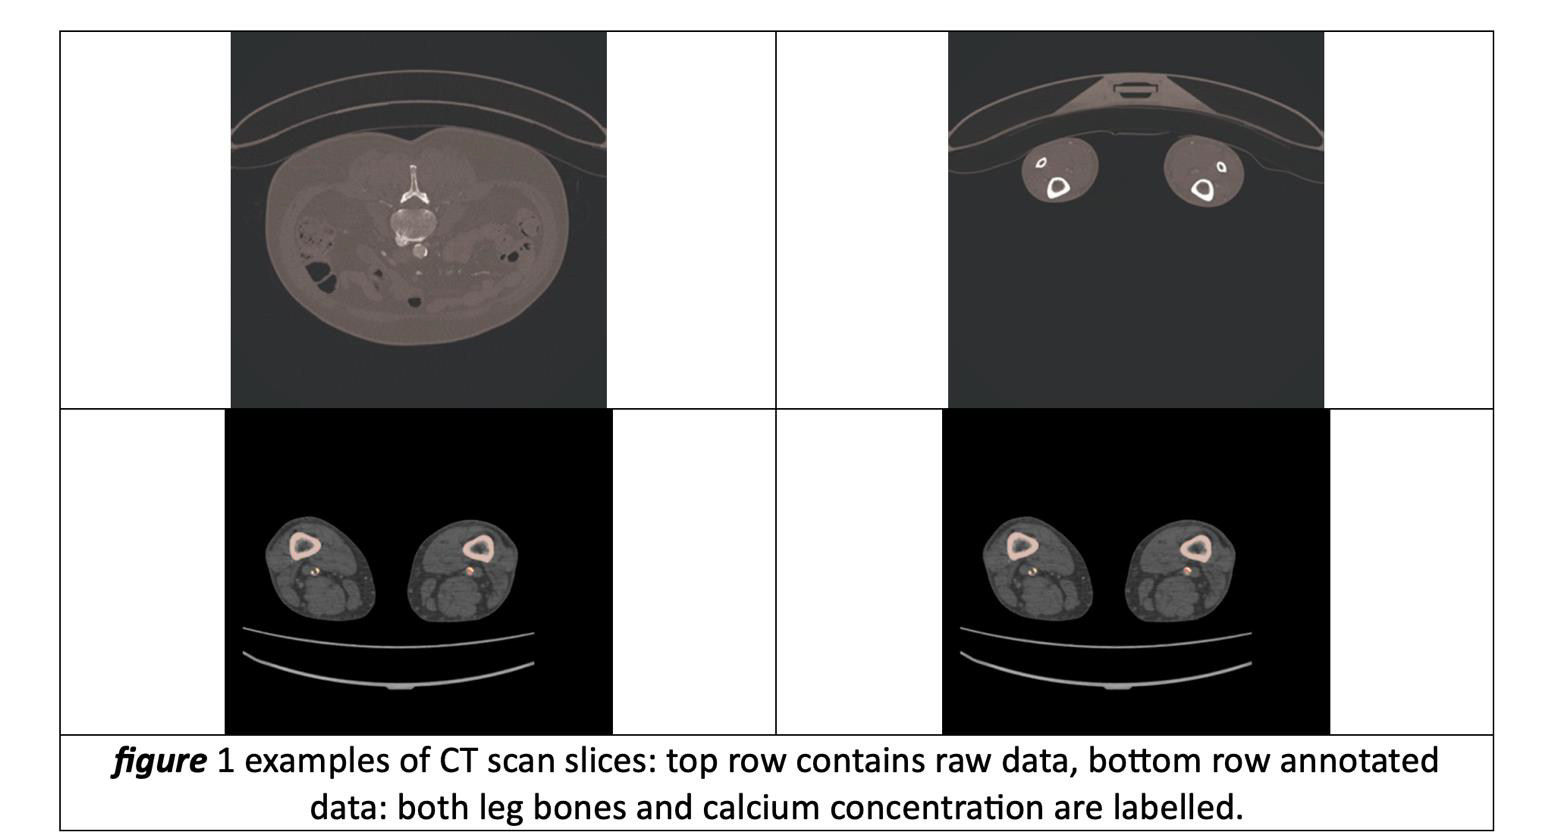
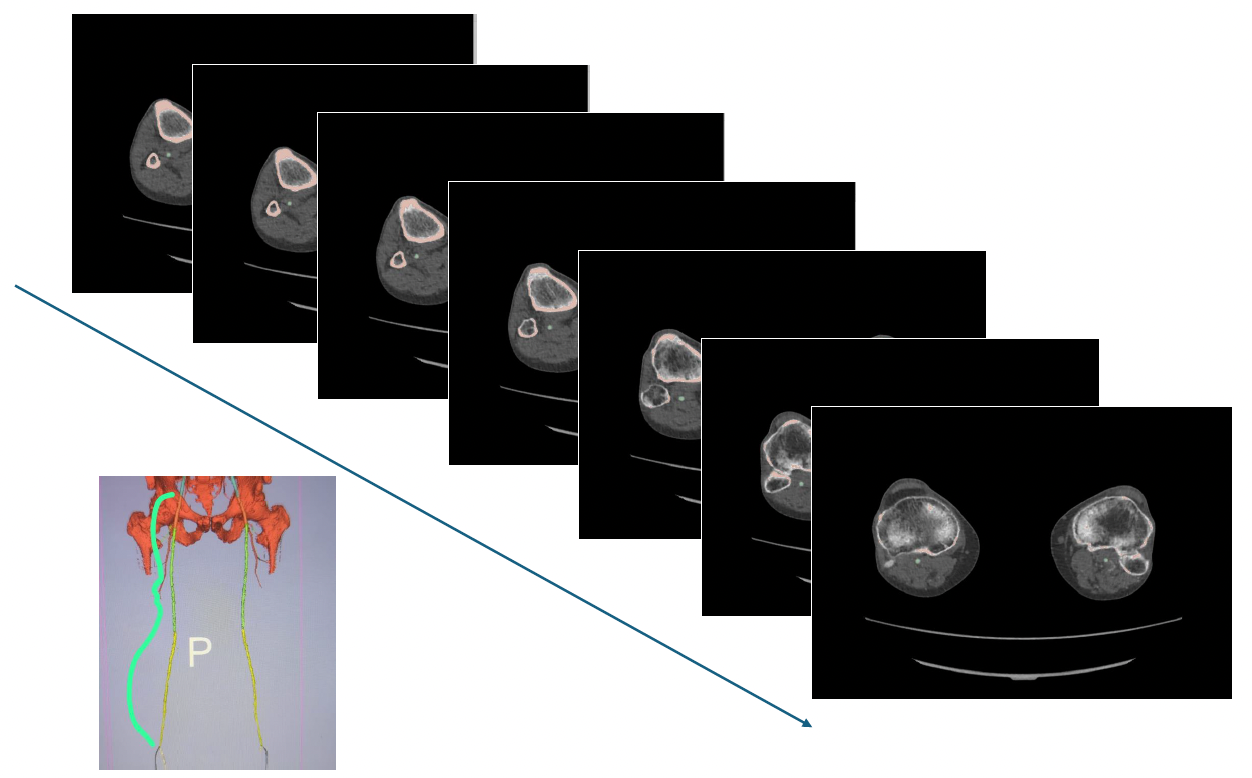
A CT scan is composed of a large and variable number of slices, each one of them is a greyscale image, examples of CT slices are provided in figure 1.
Instructions
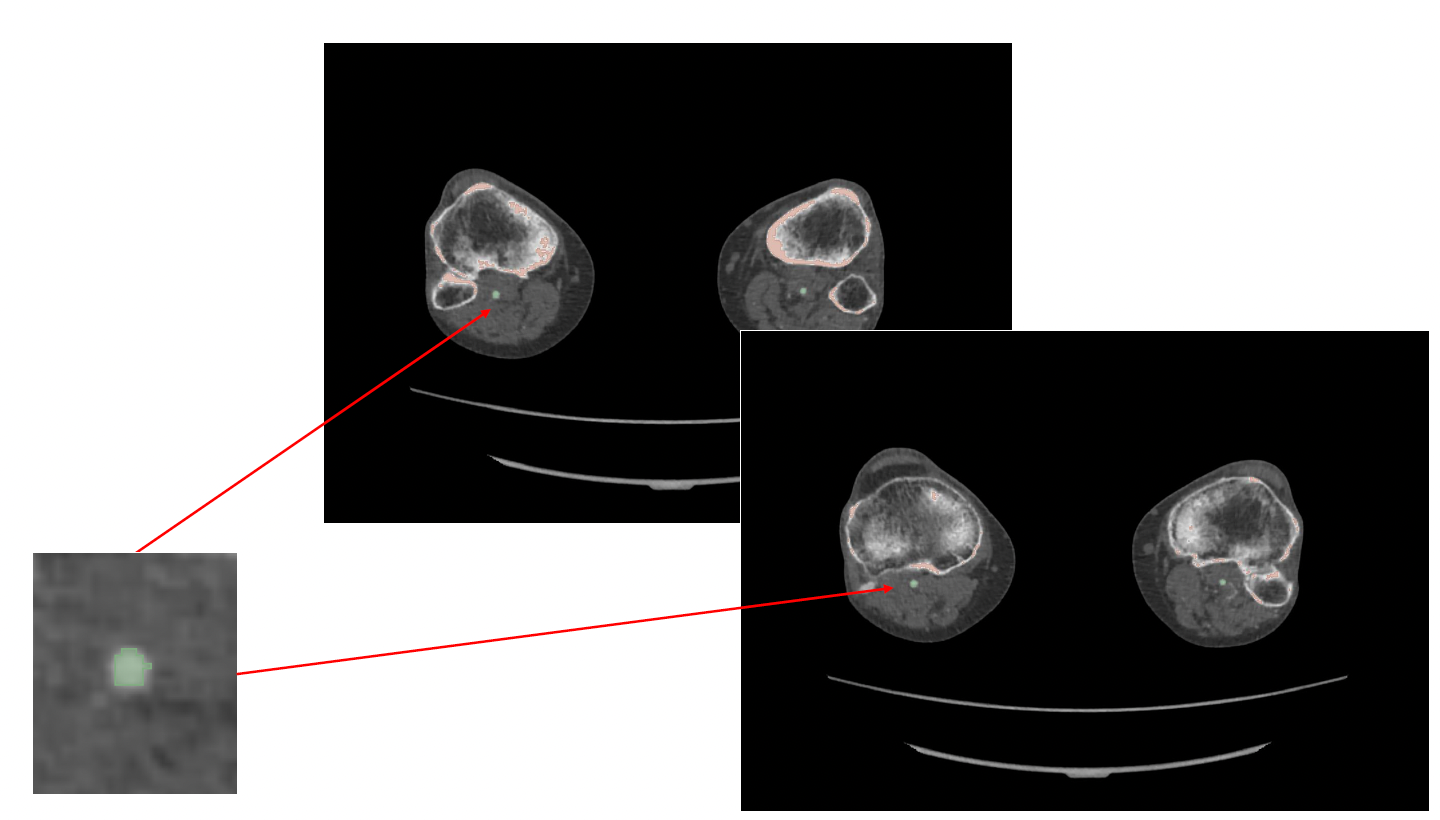
- For this part, you will have to search for areas that might indicate the presence of calcium deposit. In CT scans, calcium and bones are visible as brighter areas, while other organs usually have low intensity values. The provided data (see later in the document for details) represent portions of CT scans of the lower limbs. In simpler terms, those slices represent cross sections of both patient’s legs. Presence of calcium might indicate serious indication of blockages in the arteries. So, the larger is the amount of deposit, the higher the risk is for a patient.
Task 1
Task 1 (15%): creating masks on a slice basis
You are asked to create greyscale masks for each slice of the given CT scans. Each CT slice will need to be normalised to represent a probability density map. Segmentation must then be applied to each map to highlight those pixels that might indicate the presence of calcium concentration.
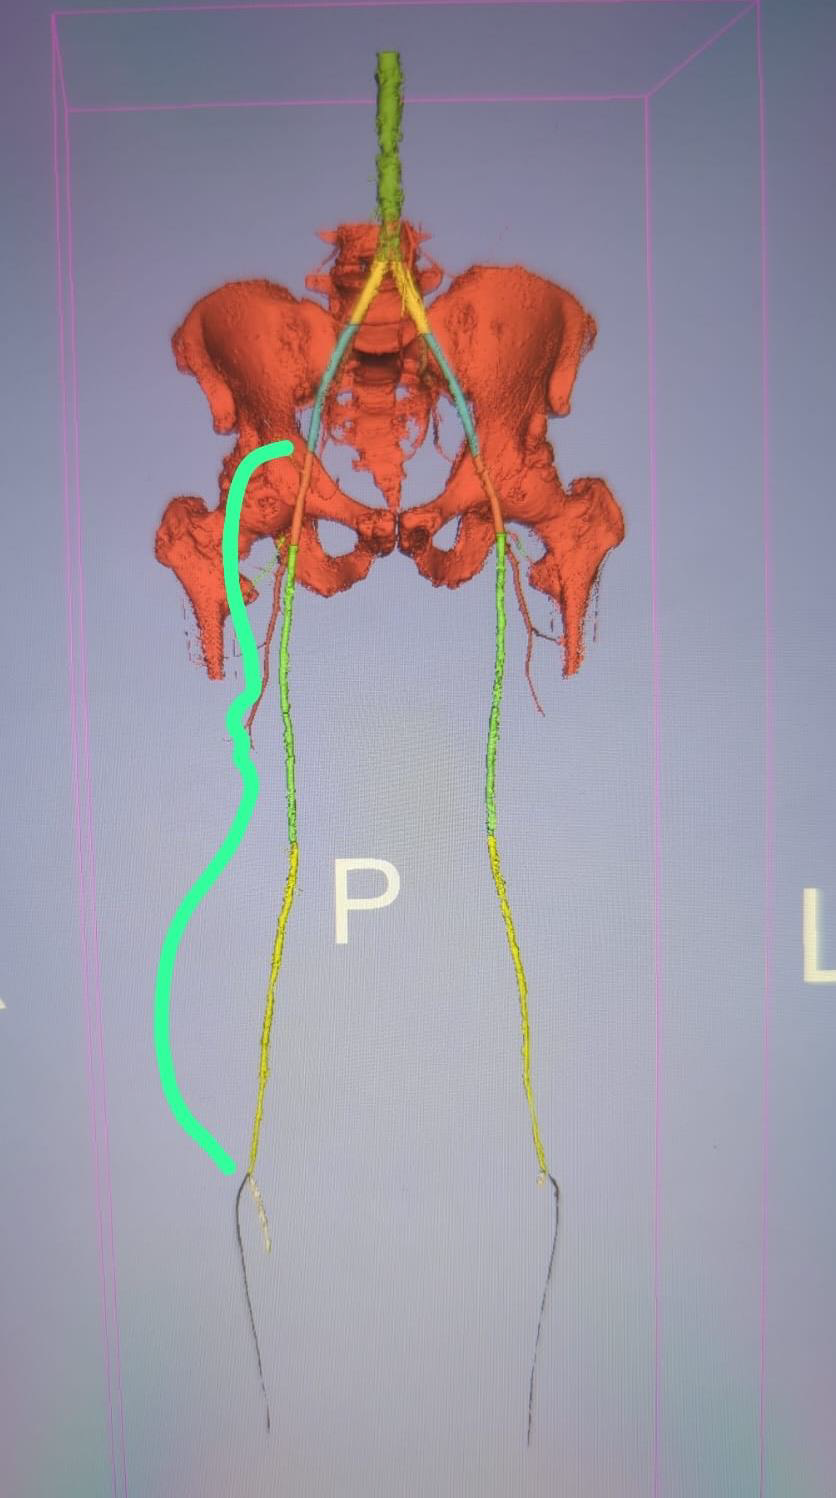
Where to look
- Please refer to the bracket highlighting the segments of a leg.
- Only the red, green and yellow segments on the left and right (this model is a segmentation from top to bottom of the leg - we will only look at the middle of the leg).
Task 2
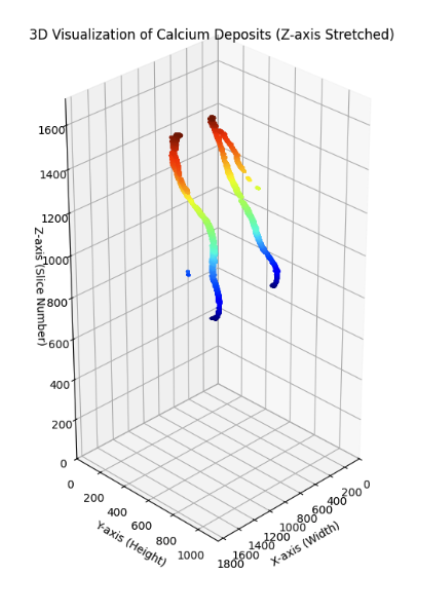
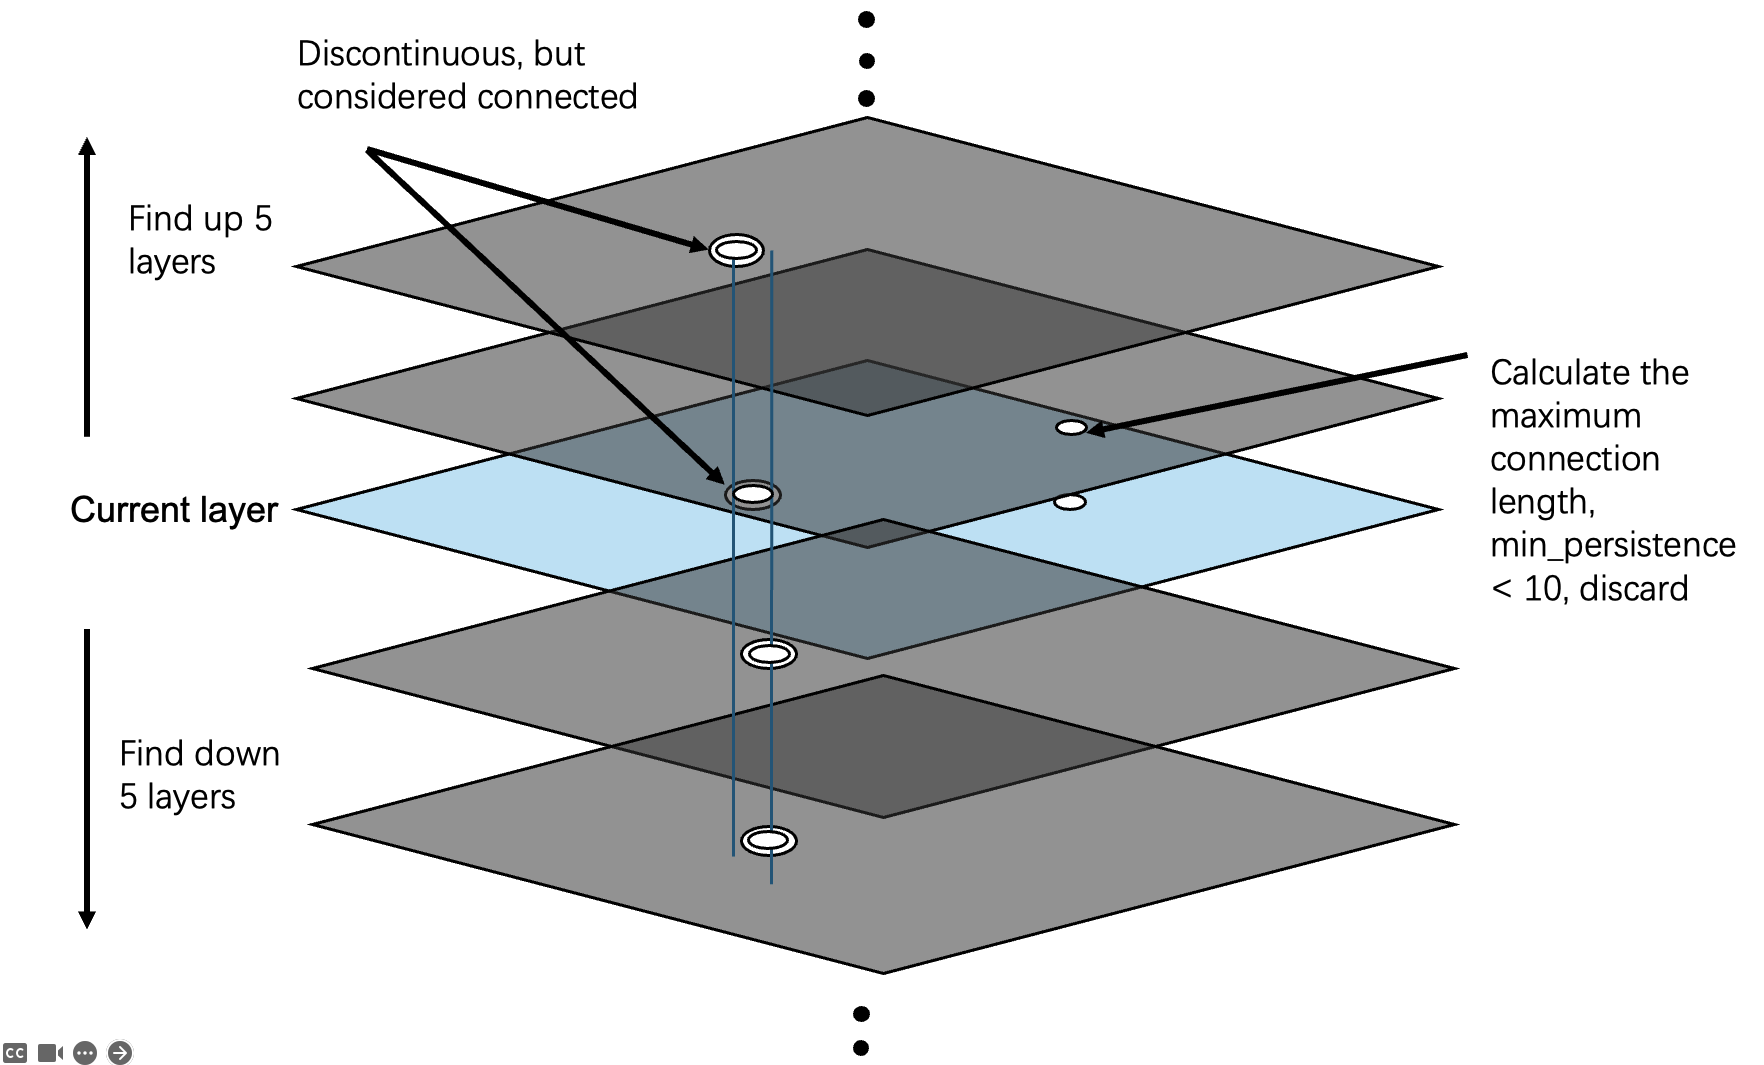
Task 2 (15%): estimating volumes of calcium deposit
Calcium deposit is a three-dimensional object, as an artery is a 3D object, while each CT slice is merely a 2D representation of the deposit at a given position in the CT scan. You are asked to make use of the probability density maps created for the previous task, to develop code to estimate the volume of calcium deposit across CT scan slices. Do assume the thickness of each slice is 0.5mm, assume pixels are squares of 1mm x 1mm size.
You are given CT scans with annotation performed by clinicians. You will have to exploit the annotated data to understand what calcium deposit looks like and find a solution to detect it.
Dataset
Dataset of CT scans will be made available by Tuesday 28th January 2025 (next week).
Marking scheme
| Task | comment | % |
|---|---|---|
| Descriptions | A general introduction to your solutions must be provided (5%), as well as a detailed description of how you solve each of the following tasks (10%). | 15 |
| Task 1 | Hint: CT scan slices are greyscale images, segmentation can be implemented using one of the taught methods/algorithms. For the normalisation and generation of probability maps needs to enforce each map to sum up to one. Marking: 10% will be assigned to a fully working method, 5% only if the method partially works. | 15 |
| Task 2 | Hint: one can think of aligning CT slices and related segmented maps. Combining adjacent slices means checking the likelihood of calcium deposit and building an estimate of the volume. Marking: the implementation must clearly demonstrate volume estimates are correctly built. Full 15% to a complete solution, if the solution works in part, then 10%. | 15 |
Submission Instructions
For each part, you are asked to create a Jupyter Notebook, where you will provide the textual description of your solutions and the implemented code. Your notebook should be structured in sections. An introduction should describe in detail the libraries you used, where to find them and how you solved the tasks. Then you should include one section for each task solution, where again you describe your solution.
The code must be executed, so that the solutions are visualised, in terms of graphics, images and results; it is strongly recommended you also include snippets of the formulae implemented by the used algorithms and the graphics of the employed architecture. Your code should be implemented in Python, using OpenCV as the main set of computer vision libraries. Please do make sure your code runs. Notebooks will have to be uploaded on Gradescope.
Solution
- 预处理
- 归一化
- 去除噪声
- 直方图均衡化
- 图像分割
- 阈值分割
- 骨骼排除
- 形态学操作:使用 开运算(opening) 以去除较大、规则的骨骼结构。
- 连通区域分析(Connected Component Analysis):识别并移除 较大的高密度区域(通常是骨骼)。