PO Lecture 3 Roofline Models
PO Lecture 3 Roofline Models
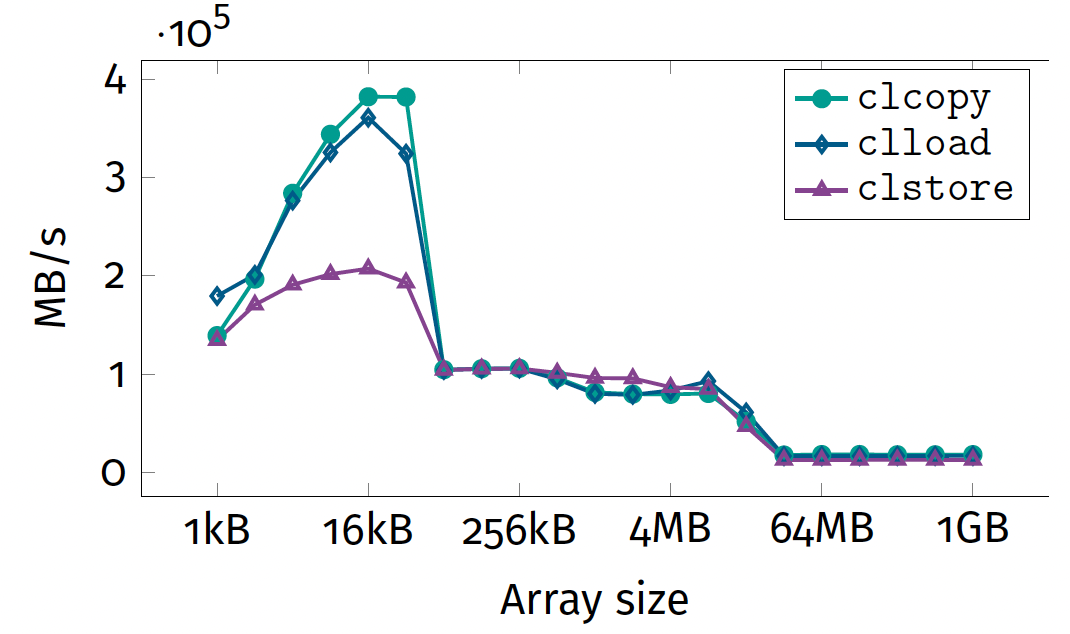
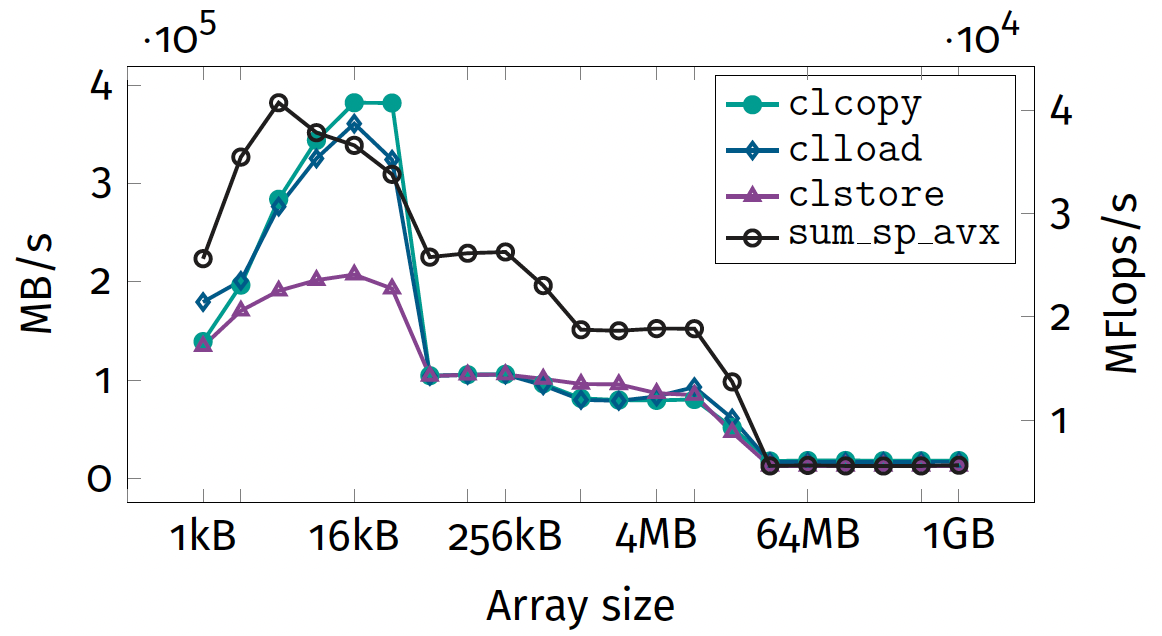
Exercise 2: results
—-wait
page4
–
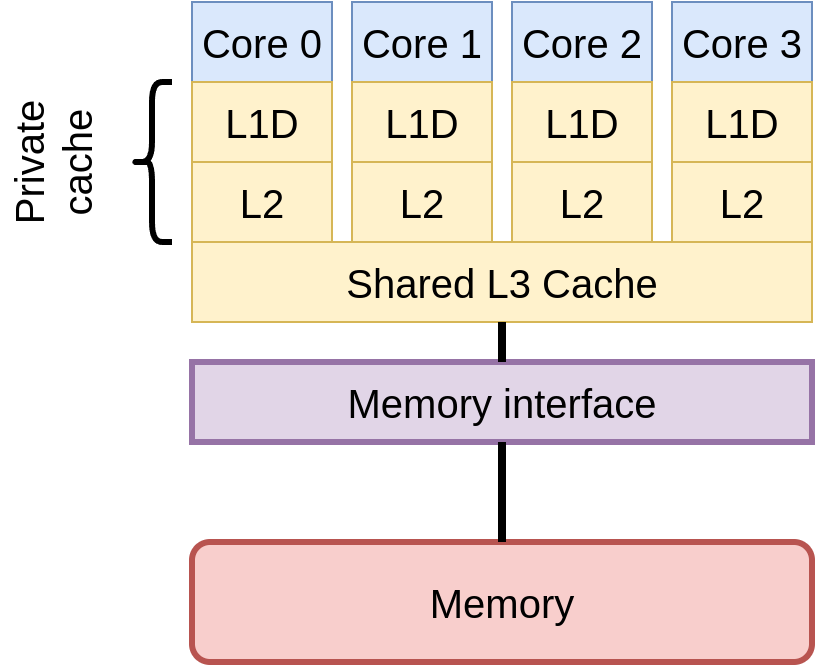
# Memory/node topology
likwid-topology reports an ASCII version of diagrams like this.
Exercise 3: results
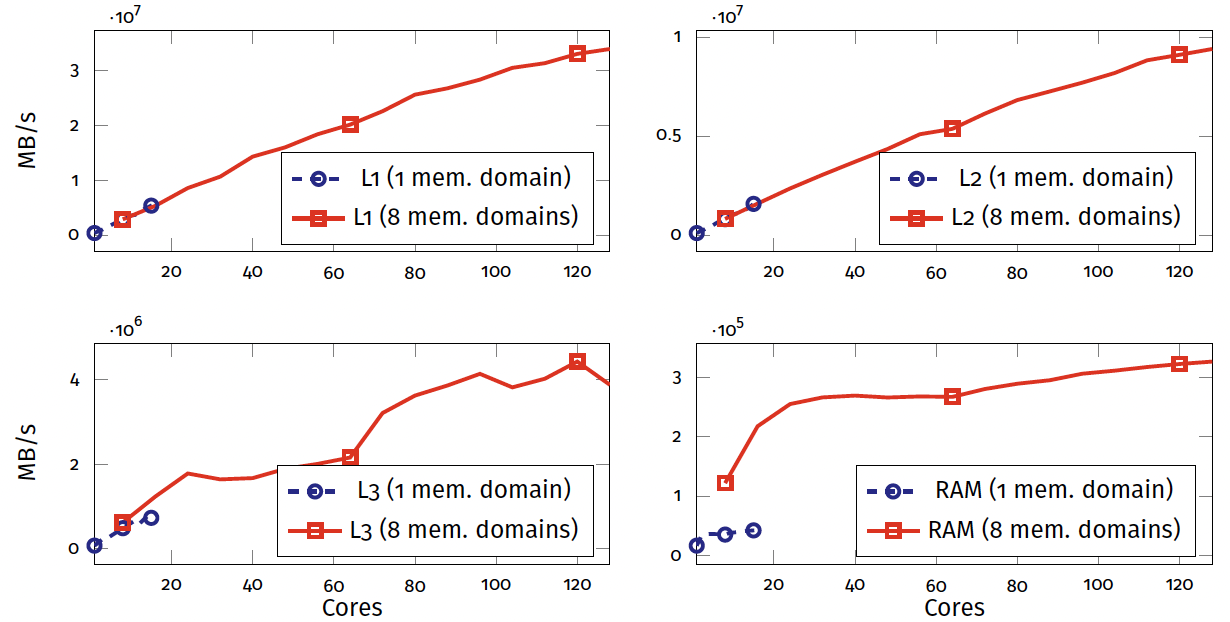
Conclusions on hardware architecture
Performance considerations
- How many instructions are required
- How efficiently a processor can execute those instructions
- The runtime contribution of the data transfers
Complex “topology” of hardware
- Many layers of parallelism in modern hardware
- Sockets: around 1-4 CPUs on a typical motherboard
- Cores: around 4-32 cores in a typical CPU
- Vectorisation: 2-16
floats per vector registers - Superscalar execution: typically 2-8 instructions per cycle
Types of resources
| Scalable | Saturating |
|---|---|
| Scales linearly | Scales sublinearly |
| - private resources | - shared resources |
| - floating-point units | - L3 memory |
| - CPU cores | - RAM |
Bottlenecks Saturating resources are the limiting factor.
Scalable vs. Saturating
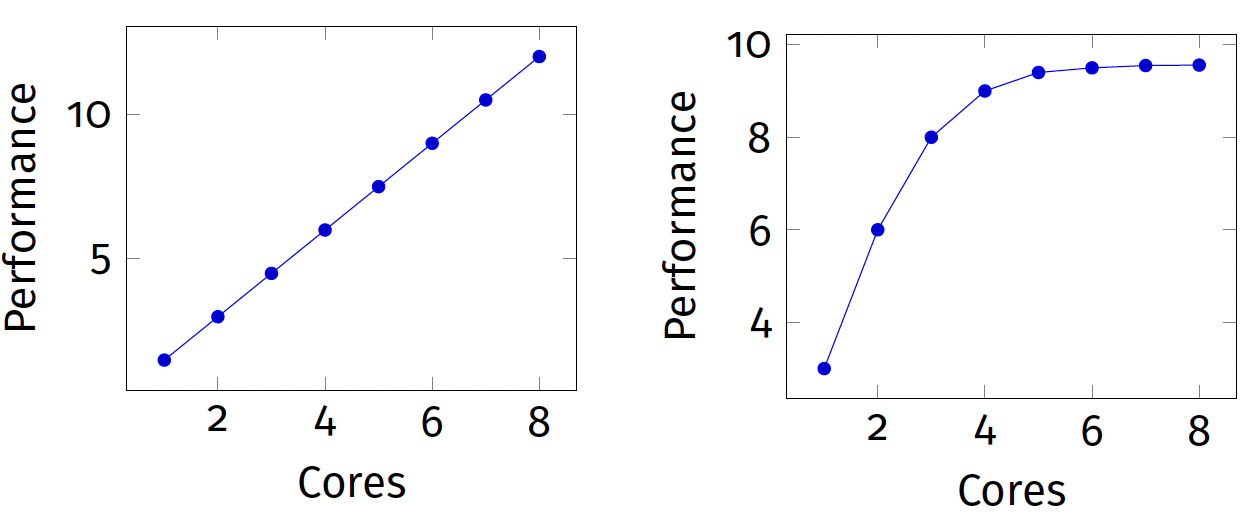
More realistic memory benchmark
The clcopy benchmark we used
- only touches one byte in each cache line
- only provides upper bounds
- is not a realistic workload
State-of-the-art alternative
- STREAM benchmark¹
- most commonly used is TRIAD
- available in
likwid-benchasstream_triad_XXX
¹https://www.cs.virginia.edu/stream/
The TRIAD loop
1
2
3
4
5
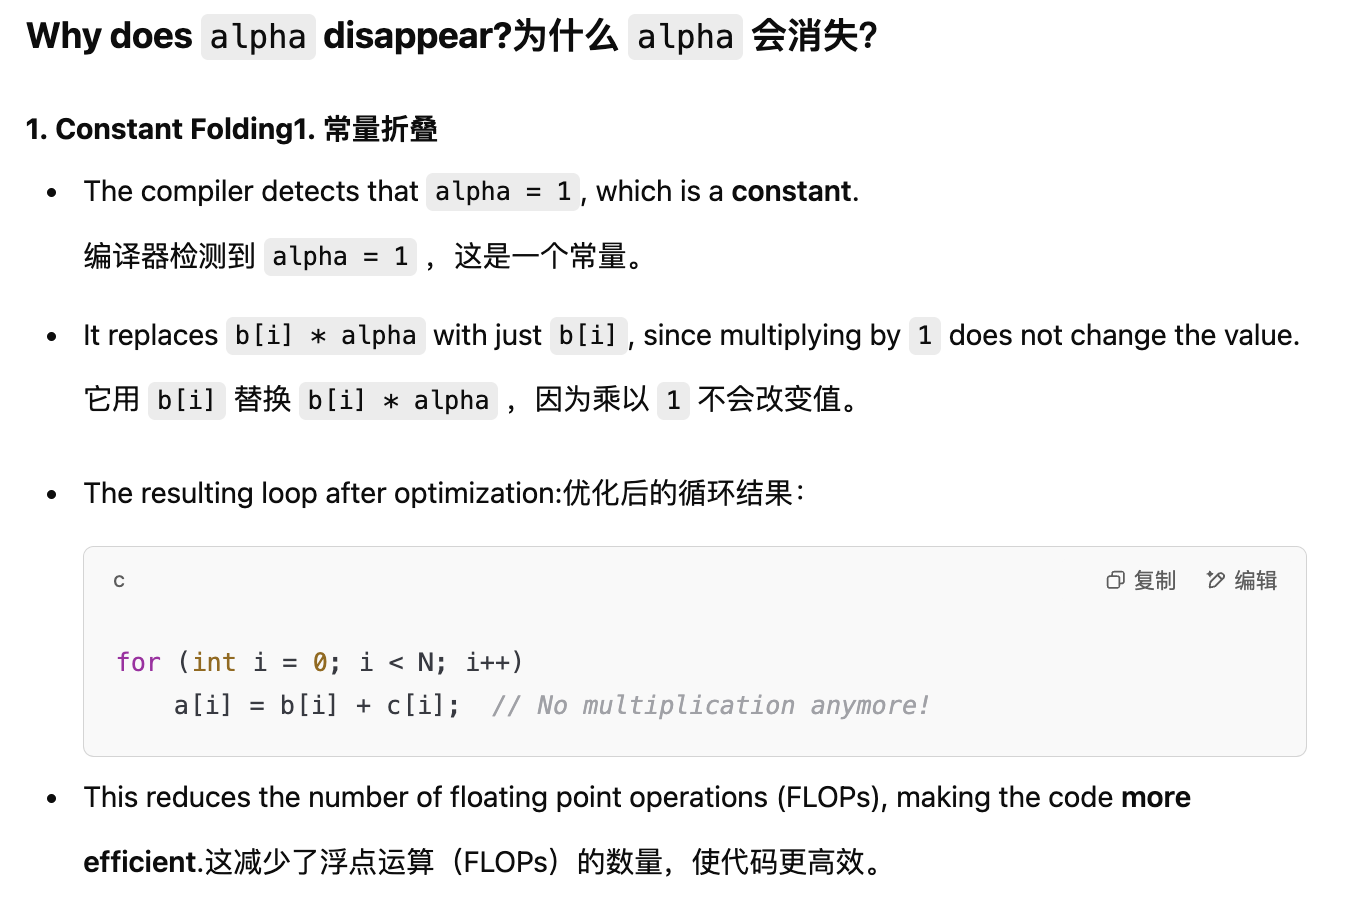
double *a, *b, *c;
double alpha = 1;
...
for (int i = 0; i < N; i++)
a[i] = b[i]*alpha + c[i];
- 2 floating point operations
- 2 loads
1 store
- ==compile -> alpha disappear why?==
Code optimisation
Simple model for loop heavy code
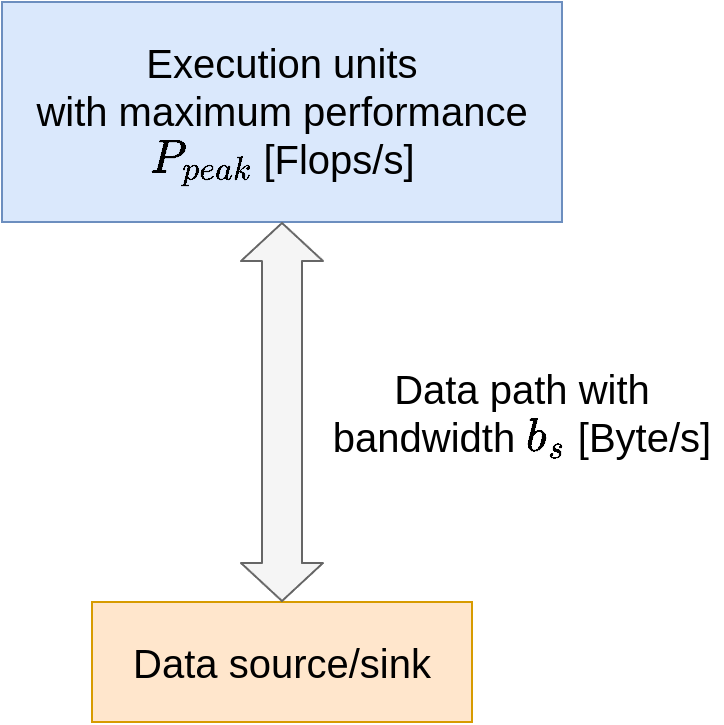
Simple view of hardware
Simple view of software
1
2
3
4
5
// Possibly nested loops
for (i = 0; i < ...; i++)
// Complicated code doing
// M Flops causing
// B bytes of data transfer
Operational intensity [Flops/B] \(I_c = \frac{M}{B}\)
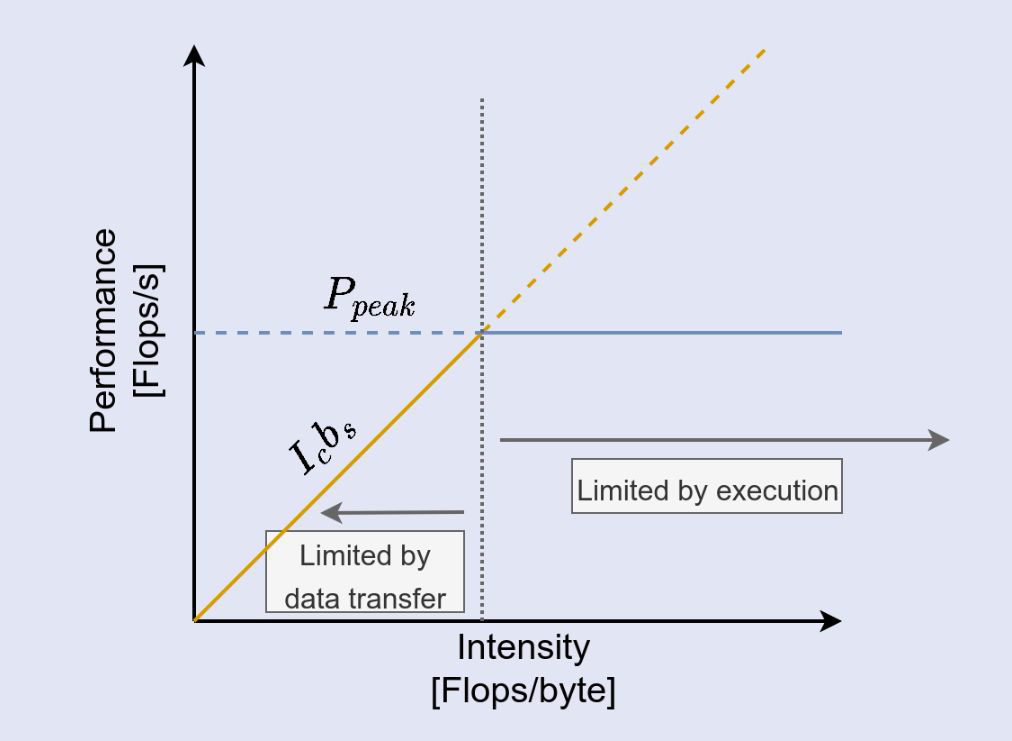
The roofline model
What is the performance P of a code? How fast can work be done? P measured in Flops/s
The bottleneck is either:
- execution of work P_peak
- or the data path I_c · b_s
Therefore: \(P = min(P_{peak}, I_c · b_s)\)
Roofline diagram
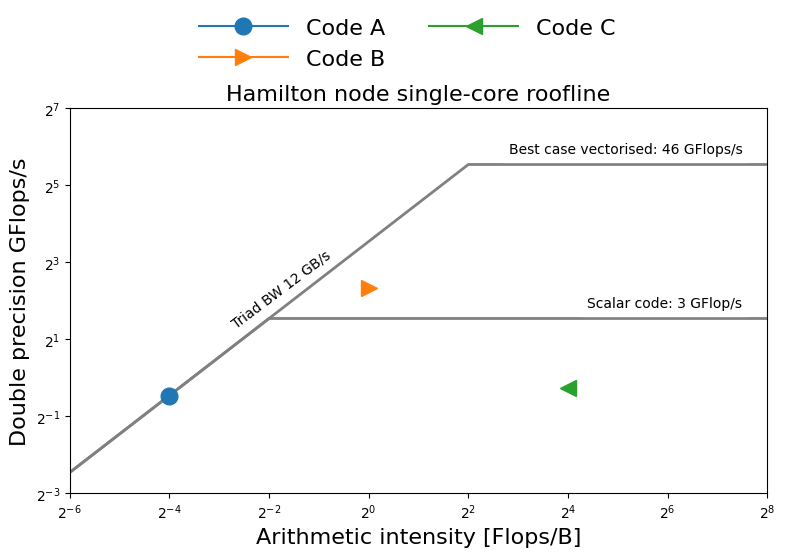
Applying roofline
Roofline characterises performance using three numbers:
- HW1. $P_{\text{peak}}$: peak floating point performance
- HW2. $b_s$: streaming memory bandwidth
- SW1. $I_c$: operational intensity of the code
- SW2. performance of the code
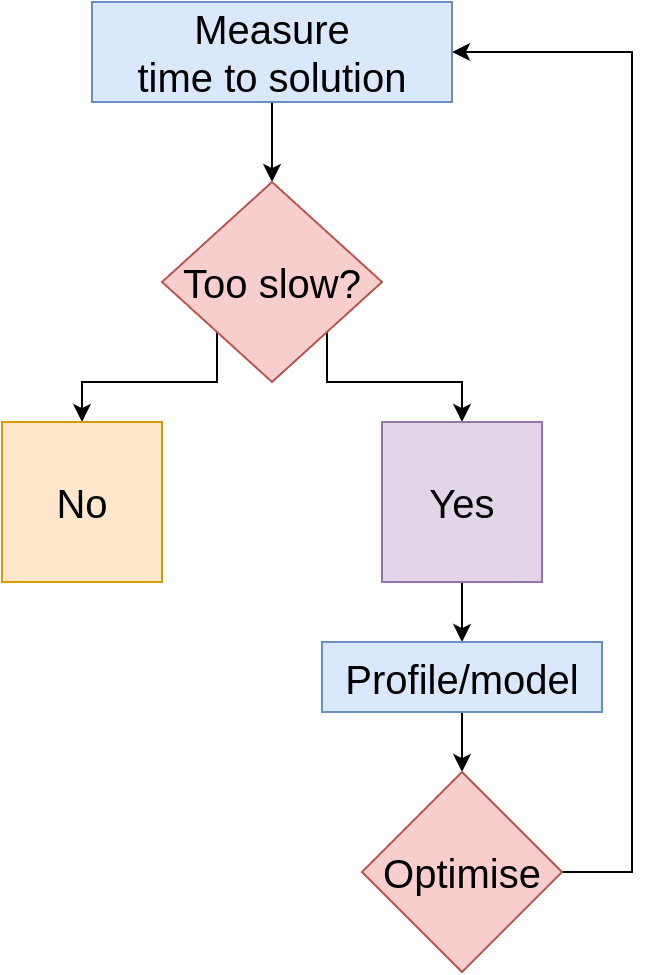
Process
- Measure these numbers
- Draw diagram
- Use diagram to choose optimisations likely to pay off
Guide for optimisation choices
Determining the memory bandwidth
Data transfers are modeled with streaming memory bandwidth
Estimating streaming memory bandwidth (STB)
- Computation
- find out speed of memory $M_s$
- find out number of memory channels $C$
- STB in B/s is $C \times M_s \times 8$
⇒ speed of memory often unknown in practice
- Measurement using STREAM
- typical solution (see exercise 4)
Determining floating point throughput
Absolute peak can be estimated from
- specification sheet frequency
- knowledge of hardware architecture
AMD Zen 2 architecture (FPU)
- Floating point instructions execute on 4 ports
- Up to 4 “$\mu$ops” issued per cycle
- up to 2 floating point instructions per cycle
- MUL and FMA ($y ← a + b × c$) are issued on ports 0 and 1
- ADD are issued on ports 2 and 3
- DIV are only issued on port 3
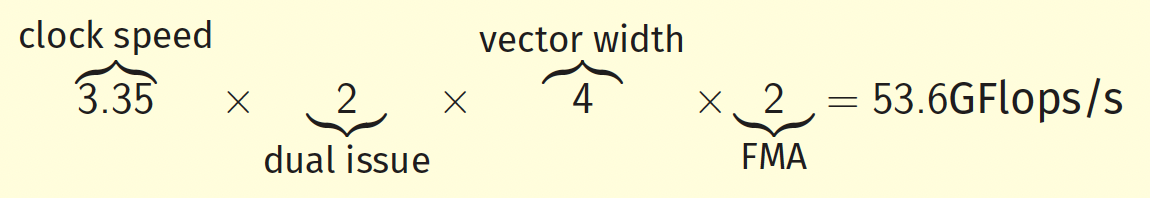
Example
Assuming a maximum clock speed of 3.35GHz
Best case: For code with only double precision SIMD FMAs, peak throughput is
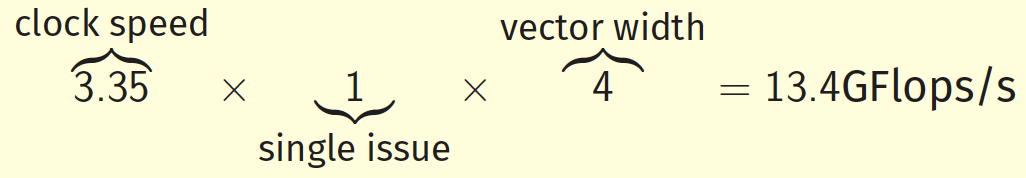
Only DIVs: Code only does double precision SIMD DIVs
Determining machine characteristics
- Sometimes multiple “roofs” for different instruction mixes
- Calculations are complicated by frequency scaling as well
More details
- https://wikichip.org for spec sheets
- https://uops.info for μops execution throughput
- Travis Down’s discussion on finding limiting factors in (simple) code
Computing operational intensity
Two options:
- measurement using performance counters
- pen-and-paper method
- count floating point operations
- count data accesses
- use formula $I_C = \frac{M}{B} $ where
- M is the number of Flops executed
- B is the number of bytes moves
Assessing operational intensity
1
2
3
4
5
6
7
8
double *a, *b, *c, *d;
...;

for (int i = 0; i < N; i++) {
    for (int j = 0; j < M; j++) {
        a[j] = b[i]*c[i] + d[i]*a[j];
    }
}
Counting operations
- 3 double-precision Flops/iteration
- 3NM total double-precision Flops
- Notice we don’t care what operations these are
Counting data accesses
- Load counts as one access, write as two (one load, one store).
- 3 reads, 1 write per iteration.
- $8 × 3N + 8 × 2M$ total bytes.
A model of cache
Perfect cache
- Lower bound
- Data moved to cache once
- Counts unique memory accesses
- $8 \times 2M + 8 \times 3N$ total bytes
Pessimal cache
- Upper bound
- Each array access misses cache
- Counts total memory accesses
$8 \times 2MN + 8 \times 3MN$ total bytes
- These bounds are typically not tight
- Better bounds normally require more work in the analysis
- Best employed in combination with measurement of operational intensity