GPU 01 Excersie 2 3
Exercise 2
Memory bandwidth in the memory hierarchy
The goal of this exercise is to determine the memory bandwidth as a function of the amount of data we are moving on the Hamilton cores.
As done in the the first exercise we will use likwid-bench. This time we will use three different benchmarks:
- clcopy: Double-precision cache line copy, which only touches first element of each cache line.
- clload: Double-precision cache line load, which only loads first element of each cache line.
- clstore: Double-precision cache line store, which only stores first element of each cache line.
These benchmarks do the minimal amount of work while moving data in cache lines (64 bytes at a time), and therefore they exercise the memory bandwidth bottlenecks (rather than instruction issue or similar).
Running the benchmarks
As mentioned, this time we want to measure memory bandwidth with the clcopy, clload, and clstore benchmarks. We are interested in the (highlighted) MByte/s output of likwid-bench. For example running
1
likwid-bench -t clcopy -w N:1kB:1
produces the following output.
1
2
3
4
5
6
7
8
9
10
11
12
13
14
15
16
17
18
19
20
21
22
23
24
25
26
27
28
29
30
31
32
33
34
35
36
37
Warning: Sanitizing vector length to a multiple of the loop stride 32 and thread count 1 from 62 elements (496 bytes) to 32 elements (256 bytes)
Allocate: Process running on hwthread 22 (Domain N) - Vector length 32/256 Offset 0 Alignment 512
Allocate: Process running on hwthread 22 (Domain N) - Vector length 32/256 Offset 0 Alignment 512
--------------------------------------------------------------------------------
LIKWID MICRO BENCHMARK
Test: clcopy
--------------------------------------------------------------------------------
Using 1 work groups
Using 1 threads
--------------------------------------------------------------------------------
Running without Marker API. Activate Marker API with -m on commandline.
--------------------------------------------------------------------------------
Group: 0 Thread 0 Global Thread 0 running on hwthread 22 - Vector length 32 Offset 0
--------------------------------------------------------------------------------
Cycles:                 4032322860
CPU Clock:              1996234632
Cycle Clock:            1996234632
Time:                   2.019964e+00 sec
Iterations:             536870912
Iterations per thread:  536870912
Inner loop executions:  1
Size (Byte):            512
Size per thread:        512
Number of Flops:        0
MFlops/s:               0.00
Data volume (Byte):     274877906944
MByte/s:                136080.57
Cycles per update:      0.234712
Cycles per cacheline:   1.877697
Loads per update:       1
Stores per update:      1
Load bytes per element: 8
Store bytes per elem.:  8
Load/store ratio:       1.00
Instructions:           5905580048
UOPs:                   7516192768
--------------------------------------------------------------------------------
Exercise
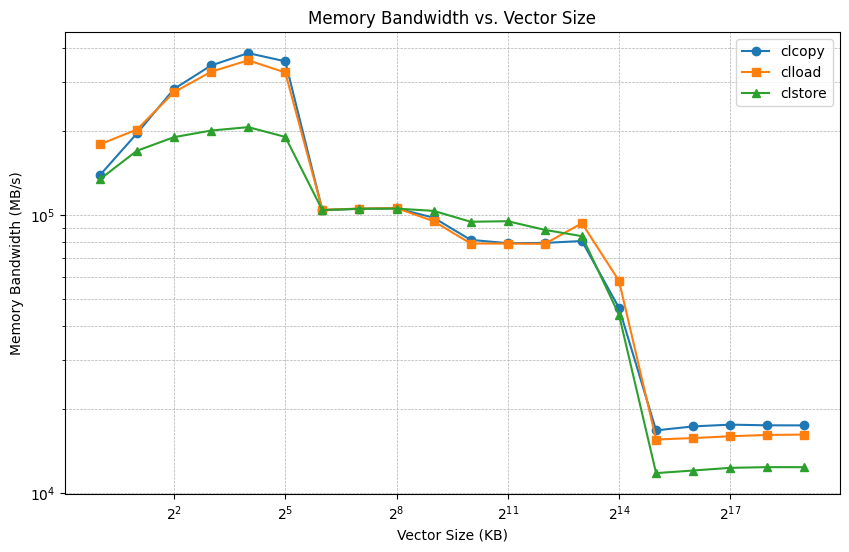
Produce a plot of memory bandwidth as a function of the size vector being streamed from 1kB up to 1GB for each of the three different benchmarks.
As before, you can script this data collection with a bash loop.
Question
What do you observe about the available memory bandwidth? Is the bandwidth the same for 1kB and 1GB vectors? Why?
Exercise
Use likwid-topology to find out about the different sizes of cache available on the system. You can find out how to use it by providing the -h command-line flag. The graphical output (-g) is most useful. However, a compute node of Hamilton 8 has 64 cores per socket, which will most likely mess up the view; the command less -S might come in handy.
Question
Can you use the output from likwid-topology to explain and understand your memory bandwidth results?
Exercise 3
Multi-core memory bandwidth
The goal of this exercise is to measure the memory bandwidth for various vector sizes as a function of the number of cores used to process the vector.
Again, we will do this with likwid-bench. This time, we will use the clload benchmark.
Topology of a compute node
Exercise
The first thing we need to do is figure out what the topology of the node we’re running on is. We can do that by running likwid-topology -g. We can use this to guide appropriate choices of vectors.
Question
The output of likwid-topology should help you answer these three questions:
- How many sockets does a compute node have?
- How many cores does each socket have?
- How large are the L1, L2, and L3 caches?
- Which cache levels are private?
- How many cores share the shared cache?
Having answered these questions, you should be able to pick appropriate vector sizes to test the parallel memory bandwidth of both cache and main memory.
The likwid-bench workgroups
Selecting the number of cores to use
You should have found that a compute node of Hamilton 8 has two sockets, each socket has 64 cores, and each core has one thread. You should also have determined that the sizes of the L1, L2, and L3 caches are 32kB, 512kB, and 16MB, respectively, and the first two levels are core-private whereas the last level is shared by a group of four cores. Now we want to run some memory benchmarks on multiple cores with likwid-bench.
In order to select the number of cores to allocate to the benchmark, we have to adapt the workgroup string (the string following the -w flag). Previously, we just used -w N:size:1; the components of this string are:
- N : The affinity domain on which to allocate the vector. We do not specify any affinity domain with N, but we can use S0 or S1 to choose one of the two sockets.
- size : The size of the vector.
- 1 : The number of cores to use.
To change the number of cores, we replace 1 by our choice (say 2). The vector size is the global vector size, so if we run with a vector size ) elements.
For example, to run with 4 cores on the same socket so that each core handles 4kB of data, we run likwid-bench -t clload -w S0:16kB:4, which should produce output like the below
1
2
3
4
5
6
7
8
9
10
11
12
13
14
15
16
17
18
19
20
21
22
23
24
25
26
27
28
29
30
31
32
33
34
35
36
37
38
39
40
Warning: Sanitizing vector length to a multiple of the loop stride 32 and thread count 4 from 2000 elements (16000 bytes) to 1920 elements (15360 bytes)
Allocate: Process running on hwthread 0 (Domain S0) - Vector length 1920/15360 Offset 0 Alignment 512
Initialization: First thread in domain initializes the whole stream
--------------------------------------------------------------------------------
LIKWID MICRO BENCHMARK
Test: clload
--------------------------------------------------------------------------------
Using 1 work groups
Using 4 threads
--------------------------------------------------------------------------------
Running without Marker API. Activate Marker API with -m on commandline.
--------------------------------------------------------------------------------
Group: 0 Thread 1 Global Thread 1 running on hwthread 1 - Vector length 480 Offset 480
Group: 0 Thread 3 Global Thread 3 running on hwthread 3 - Vector length 480 Offset 1440
Group: 0 Thread 2 Global Thread 2 running on hwthread 2 - Vector length 480 Offset 960
Group: 0 Thread 0 Global Thread 0 running on hwthread 0 - Vector length 480 Offset 0
--------------------------------------------------------------------------------
Cycles:                 3763788760
CPU Clock:              1996231214
Cycle Clock:            1996231214
Time:                   1.885447e+00 sec
Iterations:             536870912
Iterations per thread:  134217728
Inner loop executions:  15
Size (Byte):            15360
Size per thread:        3840
Number of Flops:        0
MFlops/s:               0.00
Data volume (Byte):     2061584302080
MByte/s:                1093419.21
Cycles per update:      0.014605
Cycles per cacheline:   0.116843
Loads per update:       1
Stores per update:      0
Load bytes per element: 8
Store bytes per elem.:  0
Instructions:           56371445776
UOPs:                   48318382080
--------------------------------------------------------------------------------
At the top, likwid-bench reports which cores were used. The rest of the output is the same as for the previous exercises. Again, we are interested in the highlighted memory bandwidth line.
Benchmarking on multi-socket systems
If the node has more than one socket, we need to make sure that we allocate the vector on the correct socket. For example, if we have two 64-core sockets and want to benchmark the main memory bandwidth on all 128 cores, we should write
1
likwid-bench -t clload -w S0:1GB:64 -w S1:1GB:64
This tells likwid-bench to allocate two vectors each of 1GB, one on each socket, and to use 64 cores on each socket.
Measuring the memory bandwidth
Exercise
You should now produce plots of memory bandwidth as a function of the number of cores for data at different levels in the memory hierarchy.
For the private caches (L1, L2), pick a vector size such that the vector fills about half the cache on each core.
For the L3 cache, pick a vector size to fill around two-thirds of the cache.
For the main memory, pick a vector size of around 1GB/socket.
You should produce plots of the memory bandwidth as a function of the number of cores for each of these different vector sizes.
Question
Do you observe any difference in the scalability of the memory bandwidth when you change the size of the vectors?
Can you explain what you see based on the notion of shared and scalable resources?